

Summary
Instructor David Elsner provides a walkthrough of the remote course experience in MBAN 5140 Visual Analytics and Modelling. David navigates through the course from the student’s perspective, highlighting synchronous and asynchronous activities, interactive course modules, and opportunities for community building throughout.
Video Transcript
Hi. My name is David Elsner and I am an instructor at the Schulich School of Business at York University in Toronto, Canada. I would like to welcome you to MBAN 5140, Visual Analytics and Modelling. This is an exciting course that will be delivered remotely. Let me take a few minutes to walk you through the student learning experience. This course is an introduction to the fundamental theories of visual communication design applied in data visualization and visual analytics.
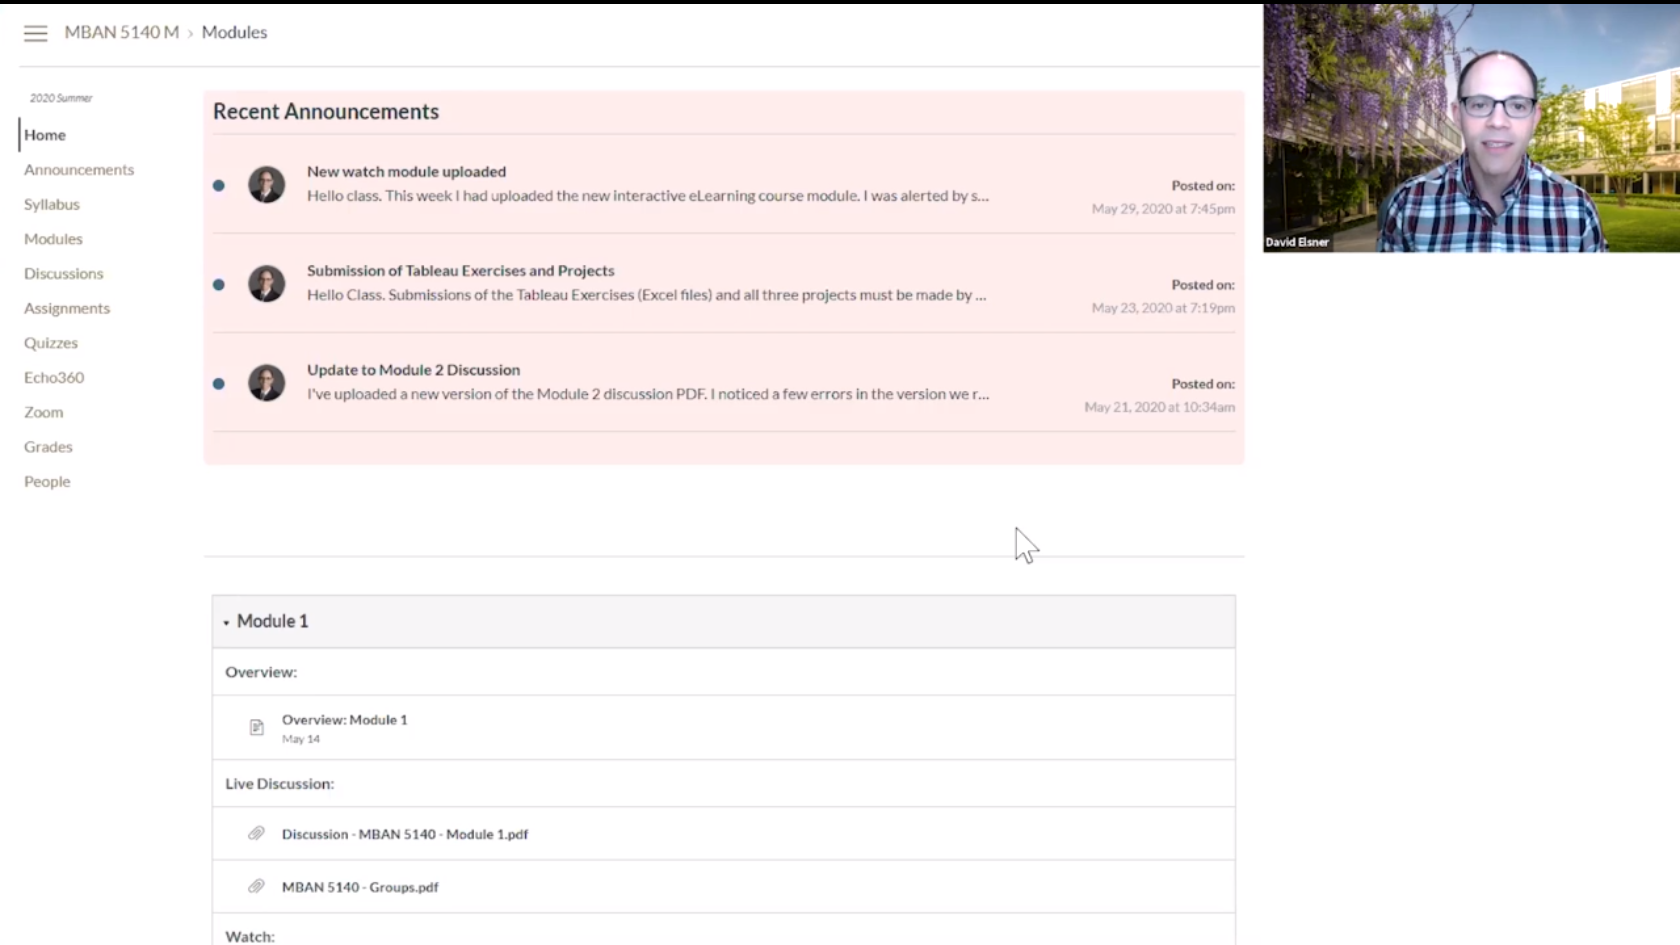
The hub for MBAN 5140 is the Canvas Learning Management Platform. It is a digital learning environment that is essentially a virtual classroom, where we create, store, share and communicate for the class. In Canvas, you begin by seeing recent announcements that I regularly make to the class, informing students of activities, new content, and upcoming dates. Students can also view the course syllabus, that provides a complete overview of the class. It includes Materials & Outcomes, Assignments, a Class-by-class outline, student expectations, and Schulich policies.
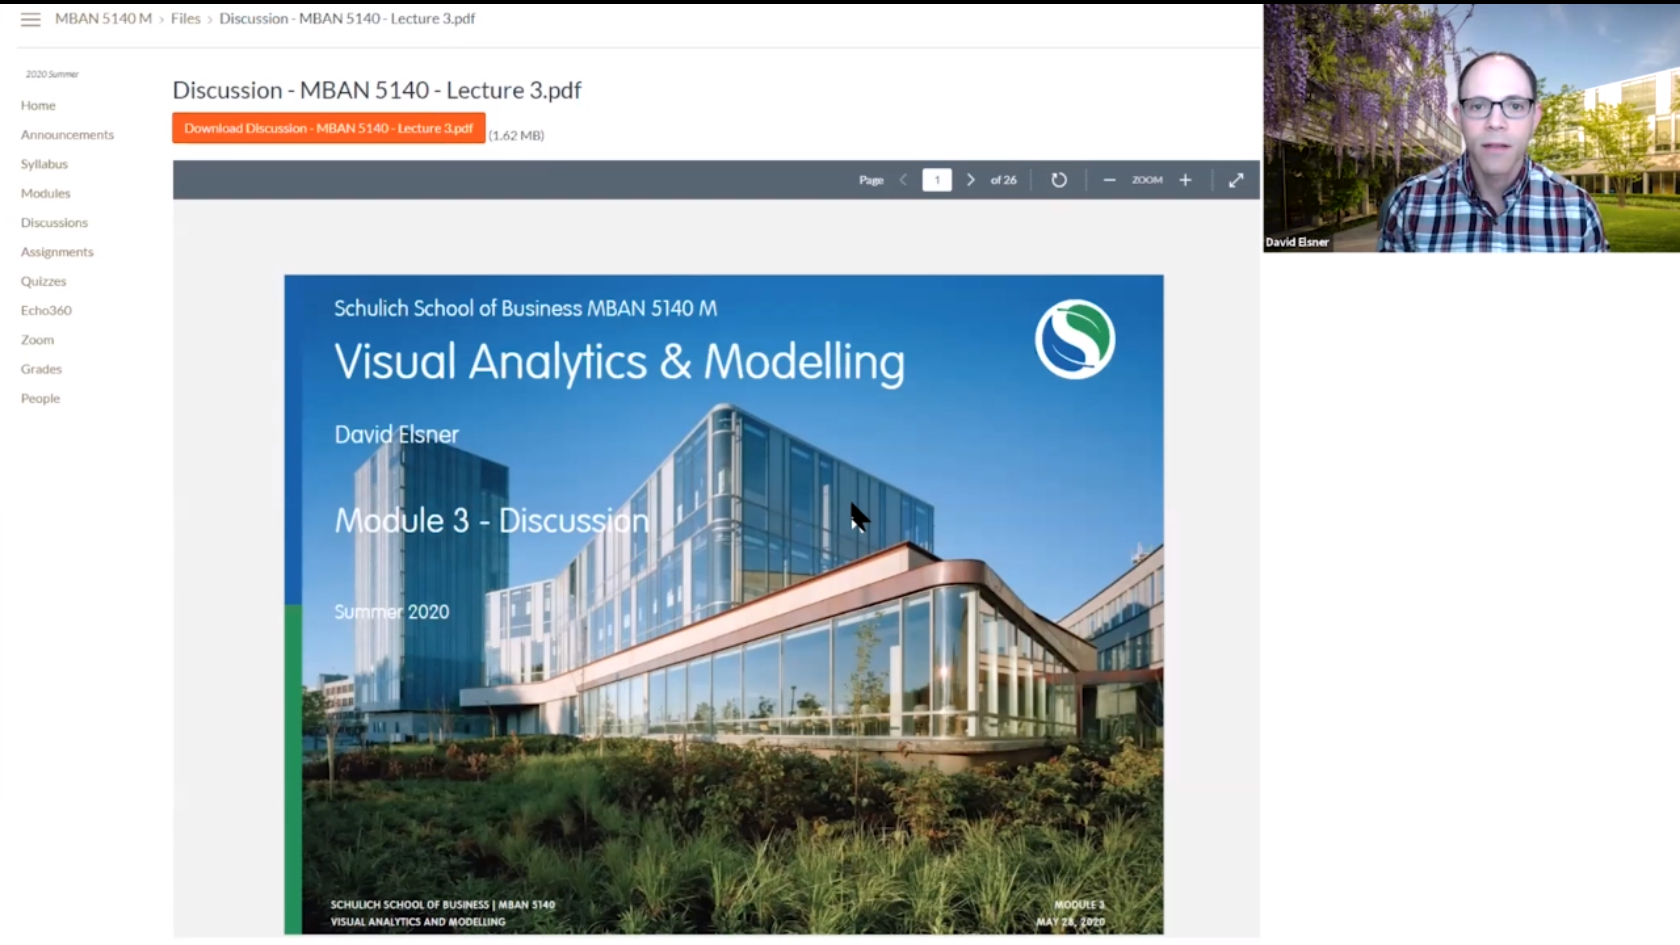
The next important item are Modules, which is the list of content for each week’s class. For MBAN 5140, each module is broken into multiple sections – an overview of the week’s content, the live discussion slides for Zoom, and the offline content for students to complete during the week, which includes eLearning modules, links to suggested readings and videos, weekly assignments, and files to download. By placing all the course content into the modules, it makes it really easy for students to navigate the course and see what they need to accomplish for that week.
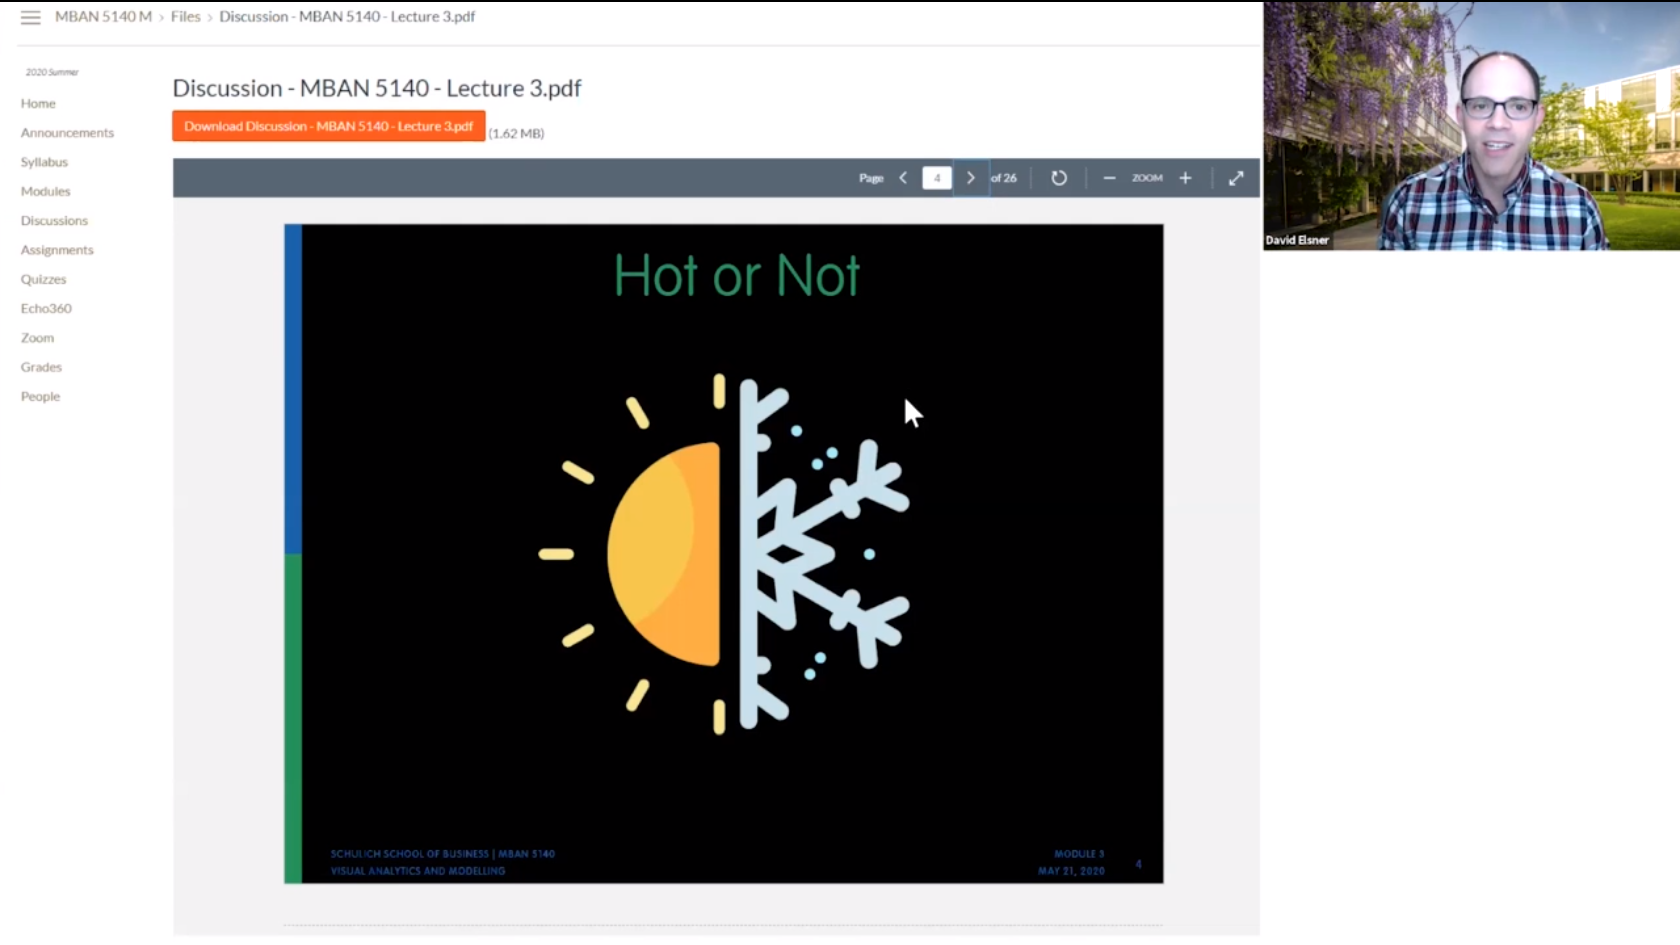
Each week, students use Zoom to login to a 1.5 hour live lecture on visual analytics and modelling. This is an example of what they see. I interact with students as we discuss the weekly materials. We start off by reviewing this week’s topics. From there, we discuss the weekly “HOT or NOT”, the good and bad of data visualizations. Students meet to discuss these visualizations in their online group discussion boards prior to that week’s lecture. I take a virtual poll in Zoom so the class can see what everyone thought of the visualizations. After the HOT or NOT, we discuss the weekly topics. During this lecture, I ask students questions and they can ask me as well.
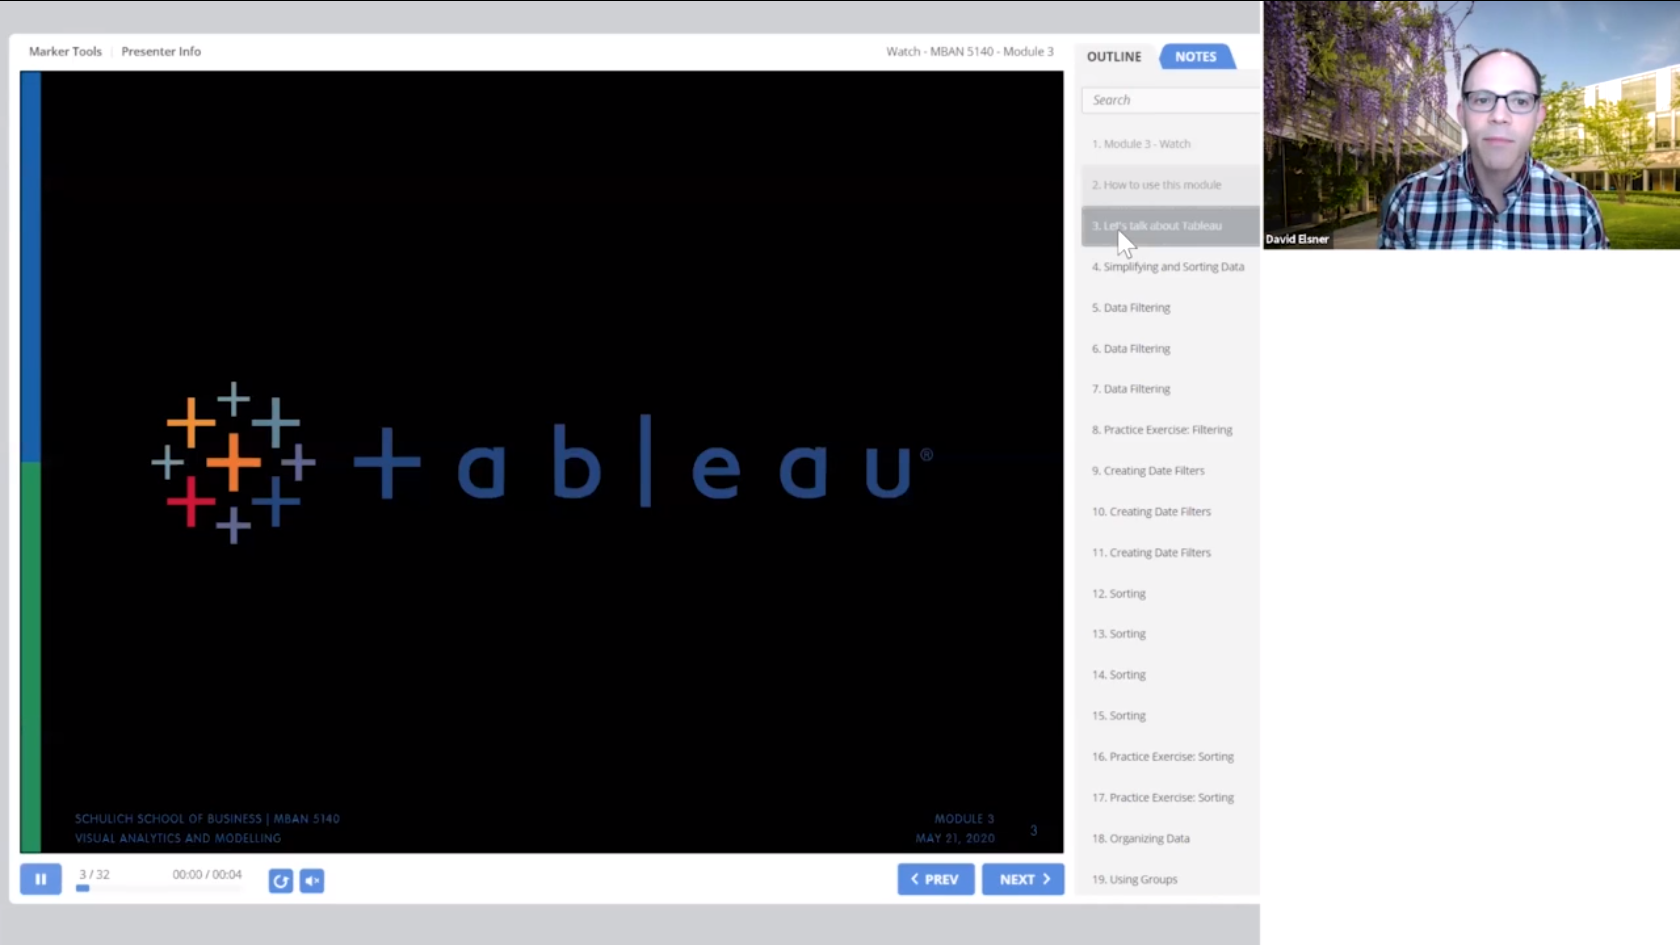
After the lecture, students learn how to model, analyze, and visualize data using Tableau with interactive eLearning course modules. These modules educate and engage students to learn Tableau with audio, watch-and-repeat tutorials, and other visual content. Each module contains several “practice exercises” for students to learn and practices their skills. A weekly online quiz tests student’s completion of the practice exercises.
For MBAN 5140, students are assessed for their participation in the HOT or NOT group discussion boards, weekly quizzes based on the eLearning modules, four in-depth Tableau Exercises, 2 group projects, and 1 individual research analysis. In one of the group projects, students work in groups to create a comparative analysis report on at least four different examples of existing and/or emerging data visualization software. The other group project requires a group presentation of their analysis, done live over Zoom in the final class. Given that the course is taught online, I provide virtual office hours through Zoom. Students can contact me though email and we usually have a meeting within 24 hours.
I hope that you have enjoyed this overview of MBAN 5140. It’s an exciting course in how it integrates live learning, interactive eLearning, discussion boards, quizzes, and projects to create a connected learning experience.
Learn More
- Online Course Walkthrough: ACTG 5100 with Professor Cameron Graham
- Online Course Walkthrough: MKTG 5200 with Instructor Ashley Konson
- Schulich Master of Business Analytics (MBAN)
- MBAN 5140 Visual Analytics and Modelling Course Description
- Schulich Educational Technology
- Schulich Innovative Courses and Instructors